何跃, 尹小佳 , 朱超
, 朱超
四川大学商学院 成都 610064
He Yue, Yin Xiaojia, Zhu Chao
中图分类号: G353.12
通讯作者:
收稿日期: 2017-04-19
修回日期: 2017-07-31
网络出版日期: 2017-10-25
版权声明: 2017 《数据分析与知识发现》编辑部 《数据分析与知识发现》编辑部
展开
摘要
【目的】帮助企业实现精准营销, 准确识别企业用户的群体特征。【方法】对微博文本进行情感分析, 通过Ward聚类将微博发表者聚类成9类群体, 并对微博用户进行影响力识别, 从情感和影响力两个维度对各个用户群体进行分析, 利用一种改进的客户价值矩阵方法辨别不同用户群体的特征。【结果】实验结果表明: 9类用户群体对A手机品牌情感倾向存在较大的差异。A手机更受喜欢追赶时髦的女性群体以及从事IT行业的用户青睐, 并且该群体影响力较大, 能更有效地影响消费者购买该手机。【局限】在进行用户影响力识别时, 仅考虑常用指标, 未考虑用户微博被转发之后的级联影响力以及其他影响指标。【结论】本文方法能够较为准确地识别企业用户的群体特征, 为企业实现精准营销提供帮助。
关键词:
Abstract
[Objective] This study tries to identify the characteristics of consumers, aiming to improve the performance of accurate marketing. [Methods] First, we conducted sentiment analysis of the Weibo texts. Then, we divided the Weibo users into nine groups with Ward clustering technique, and identified their influences. Thirdly, we analyzed each user group from the perspectives of sentiment and influence. Finally, we extracted the users’ characteristics with a modified customer value matrix. [Results] We found significant differences among users’ sentiments on a specific cell phone brand. The fashion-chasing women and IT industry workers were in favor of this brand. They could also convince members of other groups choose the same brand. [Limitations] We only included the common indicators to examine Weibo users’ influences. [Conclusions] The proposed method could effectively identify consumers’ characteristics and promote accurate marketing.
Keywords:
Web2.0时代催生了大量的新型即时通讯工具, 微博就是典型之一, 不仅能满足现代社会大众对信息知晓权的需求, 更充分满足了大众想表达自身意见的欲望。据中国互联网络信息中心(CNNIC)公布的第39次中国互联网络发展状况统计报告, 截至2016年12月, 中国网民规模已达7.31亿, 微博用户使用率持续上升达37.1%[1]。不难发现, 微博用户已经成为中国网民的主要组成部分, 其舆论影响力不可小觑。研究微博平台的用户群体特征, 进而实现大数据精准营销, 已成为热门研究课题。本文选取国内微博平台——新浪微博作为数据收集来源, 以A手机为例, 探讨该类手机产品的客户群体特征, 进一步辅助对该产品进行精准营销。
国内外关于社交媒体上的用户群体特征的研究较多, Li[2]研究了“中国大妈”这类群体使用社交媒体活动的动机和特点, 分析她们对中国社会产生的积极或消极的影响。Koustuv等[3]收集Facebook广告平台的数据, 分析美国各州、性别、年龄、种族亲和度以及教育程度之间的差异。在算法设计方面, Gonzalez- Pardo等[4]提出一种基于蚁群化优化算法(Ant Colony Optimization, ACO)的改进方法——Bioinspired, 该算法对给定网络中的任一用户, 能够自动确定构成他们兴趣圈的不同用户, 从而进行群体特征识别。Han等[5]研究用户群体行为对信息传播的影响, 提供一个更好地分析社交网络用户群体行为特征以对信息传播产生影响的参考指标。Step等[6]使用迭代法进行主题分析, 发现大多数内容主题表达了产品的归属以及相关吸烟活动, 发布最多的用户是男生且年龄较小。
国内近几年, 基于大数据的用户群体特征分析是研究热点, 在新浪微博的研究上, 曾鸿等[7]构建了大数据环境下的用户画像, 选取当代十分具有代表性的明星, 研究他们的粉丝群体特征。彭希羡等[8]以新浪微博为视角, 研究新浪微博上不同的用户性别、认证情况、地区、个性域名、昵称以及描述等指标进行统计分析。在其他社交媒体的用户群体特征研究上, 陈梅梅等[9]与淘宝网合作依据全国网络消费者的调查数据, 使用消费决策过程理论模型, 对比分析我国网络消费者基本属性及购买行为特征, 发现我国网络消费者主要关注产品功能、规格和价格, 且商品价格承受能力与性别、年龄存在显著关系。符丹等[10]从“海淘族”的用户属性、购物行为和购物体验三个维度出发, 分析“海淘族”形成的影响因素及其典型特征。张继东[11]建立了移动社交网络用户行为和偏好的预测机制。
可以看出, 国内外对于用户群体特征的分析, 不同的学者考虑的角度以及定义的指标不尽相同, 而本文则是在结合微博文本情感分析技术、微博用户影响力识别技术以及消费者市场划分技术等的基础上, 设计一种适用于微博等社交网络的关于消费者群体的特征分析技术。
目前, 国内外学者在用户情感以及用户影响力两方面的研究都较多, 但从用户情感和用户影响力两个维度衡量用户群体特征, 进而进行精准营销的研究较少。Giatsoglou等[12]提出一种基于机器学习和文本向量表示的新方法, 能快速、灵活地检测出情感片段。Suresh等[13]采用基于聚类的情感分析方法, 提出一种新的模糊聚类模型。在用户影响力研究方面, Jendoubi等[14]提出基于Twitter的两种用户影响力最大化模型, 使用信念函数理论估计用户影响。Francalanci等[15]开发了一种基于Twitter网络探索的可视化工具, 通过浏览朋友的网络, 根据分享内容的实际影响识别关键影响者。Lahuerta-Otero[16]在识别有影响力的用户基础上, 分析具有影响力的Twitter用户的微博博文内容和数量的特点。这为利用社交网络实施营销提供了新的切入点。
本文以“新浪微博”用户数据为例, 采用大数据爬虫技术和机器学习方法对文本进行情感分析, 再将微博发表者进行聚类, 归纳出不同类别的用户群体。同时采用未确知测度算法对微博群体的不同用户进行影响力识别。最后将各个用户群体在情感倾向和影响力两个不同维度上进行综合分析, 利用一种改进的客户价值矩阵的方法辨别出不同用户群体的特征。
(1) 数据获取
利用开放源码的网页服务器Apache2.2, 通过新浪微博中提供的API接口, 在授权的第三方网站上获取数据。收集数据时使用的关键字, 主要是关于与A手机紧密相连的词组。
①指定采集对象。采集器支持对大量用户批量采集数据, 但需要把用户微博地址全部导入至循环列表中。
②设置数据提取字段。根据研究需求, 指定网页上需要抓取的数据位置及字段名。
③设置翻页循环。因为主题下的微博数量较多, 无法全部显示在一页, 所以需要设计翻页循环。
④数据采集。在完成采集流程后, 就可以开始采集数据。启动后, 采集器会根据设置的流程, 对指定的页面网址依次进行采集。
⑤数据导出。在采集任务完成后, 可以将采集到的数据导出到Excel, 以便进行数据预处理。
(2) 数据清洗
通过观察收集的数据发现, 数据具有随意性、不完整性和多样性等特点, 因此, 本文数据清洗具体步骤如下:
①通过Excel进行数据清洗和预处理, 删除乱码数据、不完整数据以及无数据的记录以及原始数据中的垃圾广告;
②采用volookup函数进行查找删除, 去除步骤①清洗后剩余数据中的相同微博用户, 同时去除剩余数据中的相同微博内容的数据;
③使用正则表达式, 删除剩余的有效微博文本中包含的网址信息(URL), 只保留文本中的文字、数字、标点和表情符号等信息。将网址去除的正则表达式定义为:
$http://\left[ \hat{\ }\backslash u4e00-\backslash u9fa5 \right]*$
(3) 基于改进的情感词典的微博情感分析
进行情感分析时, 在文献[17]的基础上改进, 创新性地提出微博表情识别和转折词的处理两种新的方法。在此基础上进行的情感分析算法不仅极大提高了文本情感识别的准确度, 而且在文本处理过于复杂、不易识别的情况下, 可通过微博表情识别技术迅速识别出用户情感倾向。
①转折词处理
考虑到转折连词的特点, 在处理转折词时, 本文提出一种加权的计算转折词前后句情感倾向值的方法。将句子以转折词为界线分为两部分, 根据知网情感词典的计算方法分别计算两部分的情感倾向值。最后将两部分分别乘以给定的权重再相加, 得出整个句子的最终情感倾向值。
在确定权重时, 根据汉语语法知识, 需要确保转折词后部分的情感分值权重大于转折词前的部分[18]。使用Delphi专家咨询法通过比较, 以此确定句子前后两部分fp和bp的权重α和β。处理带有转折词的复句如公式(1)所示。
$S(sen)=\alpha \times S(fp)+\beta \times S(bp)\ \ \ \ \alpha <\beta ,\ \alpha +\beta =1$ (1)
②表情识别
在处理表情符号时, 采用内容分析法。内容分析法是一种对研究对象内容进行深入研究和探讨, 总结其规律的定性和定量相结合的科学方法。传播学上把它定义为一种系统地、客观地、定量地描绘沟通交流的明显内容的研究方法[19]。
1)确定微博文本中每一个表情符号为一个分析单元;
2)查阅相关文献以及根据内容分析法, 制定详细的分析单元归类的标准, 确定每一个类目的情感值。在研究中, 由于认定表情符号不仅能传递微博发表者较真实的情感, 而且还能从不同的表情符号中识别出发表者通过这些表情抒发的情感的强弱。所以在制定类目时, 除了要使表情符号能区分情感倾向外, 还应赋予每一个表情符号情感的强度。所建立的类目必须满足互斥性、完备性和直观性;
3)邀请4位编码员对每一个分析单元做编码, 将不同的表情归入不同的类目中。对编码人员进行培训, 告知他们本实验的意图以及具体实施方法及步骤。编码人员进行前后4轮编码, 直到可信度检验结果达到标准为止。最后统计每一个表情符号出现在不同类目中的频数, 得到最终的表情符号划分结果;
4)统计每一个表情符号出现在不同类目中的频数, 以此对表情符号进行最终的归类。
(4) 用户情感倾向计算流程
微博文本的最终情感倾向值通过上述几种词组和短语的情感值求和得到, 当值大于0时, 表明微博文本所表述的情感为正面情感; 当值小于0时, 所表述情感为负面情感; 当值等于0时, 所表述情感为中立情感。最终的情感倾向值计算如公式(2)所示。
$S(s)=\alpha \times S(fp)+\beta \times S(bp)+S(e)\ \ \ \ \alpha <\beta ,\alpha +\beta =1$ (2)
其中,$S(fp)$为复句中转折词前的部分情感倾向值, S(bp)为转折词后的部分情感倾向值, S(e)为表情符号的情感倾向值。
用户影响力识别时, 首先运用离差最大化法对评价指标体系进行筛选, 再利用分割聚类的方法确定指标评价等级制度[20], 在此基础上计算每一个用户的单指标测度, 利用信息熵确定每个用户在每个指标上的权重, 再根据单指标测度矩阵以及指标的权重确定综合指标测度矩阵, 最后根据置信度准则确定用户影响力等级。
(1) 评价指标体系的选取
本文选取粉丝数、微博被评论数、微博被转发数三个指标[21], 同时创新性地加入了粉丝数/关注数、粉丝数/原创微博数两个指标评价一个用户的影响力。
①粉丝数: 该指标表明微博用户被其他用户所关注的程度, 是用户影响力最直接的体现。
②微博被评论数: 该数值越大说明该用户传达的信息影响范围就越广, 该用户的影响力就越大。
③微博被转发数: 该数值越大不仅能说明微博用户的微博信息传达给其粉丝这种直接的影响力越大, 还包括该信息能被传达给粉丝的粉丝这种间接的影响力。
④粉丝数/关注数: 在微博中, 有人通过购买粉丝的方式增加自己的粉丝数, 提升人气, 再与其他微博用户交易, 通过大量关注他人的微博来收取佣金。为了在实验中取得较真实的用户影响力值, 避免这种毫无意义的“互粉现象”, 可以利用“粉丝数/关注数”这一新的变量代替原来的“关注数”指标。
⑤粉丝数/原创微博数: 虽然原创微博数标志了一个微博用户在某一话题中的参与度, 但是如果发表的微博不能更有效地被其他用户接受, 那么这些微博信息将是无效信息。所以, 本文提出使用“粉丝数/原创微博数”这一变量代替原来的“原创微博数”。
(2) 评价指标等级标准的划分
本文将用户根据自身影响力划分为: 意见领袖、意见活跃分子和普通受众三个等级。使用分割聚类算法中的K-means算法将每一个评价指标下关于每个评价对象的值聚为三类, 再根据各个类别中的最小值作为等级划分标准的临界值[22]。
该算法在处理数据量较大的聚类时, 具有可伸缩性、高效性以及可以同时用于多种数据类型的优点, 其算法的时间复杂度上限为: $\text{O(n}\times \text{k}\times \text{t)}$, 其中n代表对象的数目, t为迭代的次数。
(3) 基于未确知理论的用户影响力评价模型算法
通过对评价指标体系及其标准的确定后, 利用未确知理论算法进行用户影响力值的测算。
①未确知信息测度模型
设${{x}_{1}},x{}_{2},\cdots ,{{x}_{m}}$为待评价的对象, 组成评价对象空间$X=\{{{x}_{1}},x{}_{2},\cdots ,{{x}_{m}}\}$。对于${{x}_{i}}\in X$, 有n个评价指标${{I}_{1}},{{I}_{2}},\cdots ,{{I}_{n}}$, 它们组成评价指标空间$I=\{{{I}_{1}},{{I}_{2}},\cdots ,{{I}_{n}}\}$。对于评价对象空间X中的每一个评价指标x, 它在某一个评价指标Ij下的观测值xj不同时, 根据之前确定好的评价等级标准, 将它划入不同的等级标准区间Ck的程度λjk也会不同, 其中${{\lambda }_{jk}}=\lambda ({{x}_{j}}\in {{c}_{k}})$。那么可以认为λjk是观测值xj使对象$x$处于某种等级标准程度的一种未确知测度, 它必须满足一般测度的三条准则: 归一性、可加性和非负有界性[23]。将测算出的未确知测度写成对于对象$x$的单指标测度矩阵形式[24]如公式(3)所示。
${{({{\lambda }_{jk}})}_{n\times p}}=\left( \begin{matrix} {{\lambda }_{11}} & {{\lambda }_{12}} & \cdots & {{\lambda }_{1p}} \\ {{\lambda }_{21}} & {{\lambda }_{22}} & \cdots & {{\lambda }_{2p}} \\ \vdots & \vdots & \ddots & \vdots \\ {{\lambda }_{n1}} & {{\lambda }_{n2}} & \cdots & {{\lambda }_{np}} \\\end{matrix} \right)$ (3)
其中, ${{\lambda }_{j1}}<{{\lambda }_{j2}}<\cdots <{{\lambda }_{jp}}$或${{\lambda }_{j1}}>{{\lambda }_{j2}}>\cdots >{{\lambda }_{jp}}$。
②信息熵确定评价指标系数
观测值xj使对象x处于某种等级标准程度的未确知测度如公式(4)所示。
${{\lambda }_{j}}=({{\lambda }_{j1}},{{\lambda }_{j2}},\cdots ,{{\lambda }_{jp}})$ (4)
当λj中的每个分量取值越集中, wj取值越大; 当λj中的每个分量取值越分散, wj取值越小。设关于测度λjk的信息熵[25]如公式(5)所示。
${{H}_{j}}=-\sum\limits_{k=1}^{p}{{{\lambda }_{jk}}}\cdot \log {{\lambda }_{jk}}$ (5)
根据信息熵理论, 对评价指标Ij相对重要程度的不确定性可由熵权值表示[25]如公式(6)所示。
${{V}_{j}}=1+\frac{1}{\log p}\sum\limits_{k=1}^{p}{{{\lambda }_{jk}}}\cdot \log {{\lambda }_{jk}}$ (6)
③综合测度评价向量
由关于评价对象$x$的单指标测度评价矩阵和权重向量W, 可求出多指标综合评价测度向量[26]如公式(7)所示。
$A=W\cdot {{({{\lambda }_{np}})}_{n\times p}}$ (7)
④评价准则
由于之前确定好的评价等级是有序的, 故在此不适宜使用最大测度识别准则, 改为使用置信度识别准则。通常设置信度$\theta (0.5<\theta <1)$的值为0.6或0.7, 如公式(8)[26]所示。
${k}'=\underset{k}{\mathop{\min }}\,\left\{ (\sum\limits_{i=1}^{k}{{{\mu }_{i}})\ge \lambda ,1\le k\le p} \right\}$ (8)
则判定评价对象${{x}_{i}}$属于评价等级${{c}_{{{k}'}}}$。
针对于微博及微博中的用户特点, 采用Ward聚类方法[27]对目标对象进行聚类分析, 识别出不同特性的用户群体。Ward聚类方法的基本做法和许多聚类方法一样, 都是先把每个对象看成独立的一类, 逐步归为更大的类。类别每缩减一次, 离差平方和就会增大, 合并使得S值增加最小的两个类别, 直到所有的对象都归为一类为止。
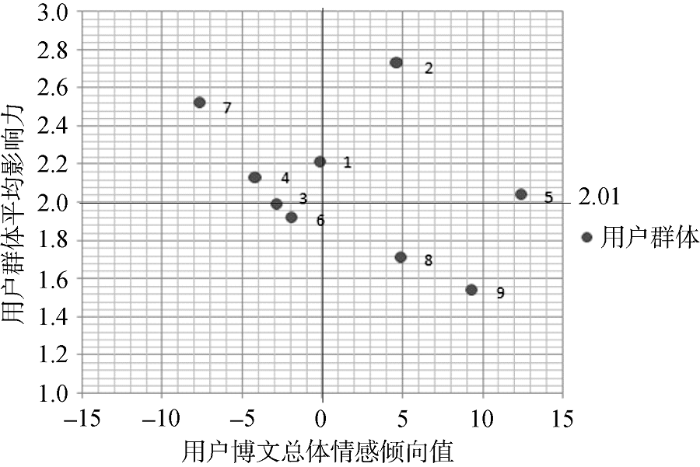
本文针对基于微博的客户细分及用户特征识别问题, 创新性地提出一种改进的客户价值矩阵。使用用户群体平均影响力和用户群体对产品的平均情感倾向值两项指标代替传统客户价值矩阵中平均消费额度以及消费频率两项指标作为分析的两个维度。分别计算出每个用户群体类别的群体平均影响力值I和群体总体情感倾向值S, 再在两个维度建立的矩阵上进行分析。4个象限的客户类型借鉴“波士顿矩阵”中对4种不同产品的命名方法, 将用户群体分为: “明星顾客”, “现金牛顾客”, “问号顾客”以及“瘦狗顾客”[8]。
数据来源为新浪微博, 实验研究的产品对象为A手机。选取在A手机上市后两个月的微博数据(2016年10月28日-2016年12月28日), 共101 123条, 涉及微博用户68 892名。在对数据进行清洗过滤后, 可用数据剩下10 853条, 涉及微博用户7 043名。剔除微博内容相同的数据后, 随机选取5 000位微博用户关于A手机产品的一条微博, 作为实验数据。
(1) 转折词处理
共邀请20名专家对句子转折词前后两部分给予赋权。这20名专家均是在汉语言文学、数学以及心理学等领域有一定研究成果的专业人士。其中教授6名, 副教授8名, 在读博士生6名; 平均年龄为42.63岁, 从事相关研究平均年限为23.45年; 专业方向: 汉语言文学7名, 数学7名, 心理学6名。通过对专家一致性检验, 第3轮专家一致性检验结果为0.82>0.80, 具有较高的可靠性。最终的赋权结果为: 句子转折词前部分权重α为0.3735, 后半部分权重β为0.6265。
(2) 表情符号处理
从实验数据中总共收集到微博表情88个, 本文确定7个表情符号类目及其相对应的情感值的表情符号。表1为表情符号的最终划分结果。经过4轮实验, 在第4轮结果的Kappa值为0.81>0.8, 是较好的可信度检验结果, 如表2所示。
表1 表情符号划分最终结果
| 类目名称 | 情感值 | 表情符号 |
|---|---|---|
| 很好 | 2.5 | 笑哈哈; 大笑; 嘻嘻; 爱你; 给力; 威武; 顶; 鼓掌; 赞; good; gst耐你; 好开心 |
| 好 | 2 | 花心; 可怜; 好激动; 江南style; 偷笑; 亲亲; 抱抱; 挤眼; ala加油; 爱心; 耶 |
| 较好 | 1.5 | It切克闹; din推撞; 兔子; 互粉; 礼物; 微笑; 可爱; 钱; 嘴馋; ok; ala蹦; 害羞; |
| 稍好 | 0.5 | 转发; 围观; 熊猫; 奥特曼; 酷; 猪头; 蜡烛; 坏笑; 勾引 |
| 没感觉 | 0 | 抠鼻; 浮云; 神马; 时间; 话筒; 疑问; 思考; 国旗; |
| 较差 | -1.5 | 晕; 黑线; 流汗; 囧; 困; 睡觉; 打哈欠; 左哼哼; 右哼哼; 吃惊; 闭嘴; 懒得理你 |
| 差 | -2 | 快哭了; 草泥马; xb压力; 吐血; 衰; 委屈; 吐; 生病; 巨汗; 非常汗; 悲催; 石化; 结冰; 给跪了 |
| 很差 | -2.5 | 怒; 怒骂; 抓狂; 崩溃; 哼; 流泪; 鄙视; 失望; 狂躁症; 弱 |
(3) 效果对比
经过加入转折词处理以及表情符号处理改进后的词典和传统词典的比较结果如表3所示。由此可以看出, 改进后的算法的准确率和召回率的宏平均值都比传统方法高。
通过改进后的情感词典的微博情感分析方法, 计算出数据集所有微博文本情感倾向值。其中正面情感倾向的微博文本有3 196条, 中立的微博文本有26条, 负面情感倾向的微博文本有1 778条。可以看出, A手机在消费群体中的口碑还是比较好的, 可以预计手机投入市场之后的销售前景还是比较乐观的。
使用SPSS 17.0 对所有实验样本进行Ward聚类分析。采用的聚类指标有5个, 除了年龄、性别和地域三种个人基本信息以外, 还加入了“IT从业人员、学生及其他”以及“发布微博所使用的终端”两个指标。因为根据市场反应, IT从业人员和学生为其主要消费者群体。最终将所有微博发布者聚为9个不同的类别。通过单因素方差分析表明所有指标的显著性水平(P值)均小于0.05, 为可接受范围。表4为聚类的最终结果以及各个类别的特征以及群体关键字。
表4 用户群体特征识别结果
| 群体关键字 | 用户数目 | 主要特征 |
|---|---|---|
| 投资者 | 308 | 1、主要是金融行业从业者; 大多为男性; 2、主要来自于北京、上海、广东和香港等经济发达地区; 3、微博主要通过iPhone手机客户端发布; 4、主要集中在35-45岁和45-55岁两个年龄段。 |
| IT业精英 | 209 | 1、主要是移动互联网和IT企业的企业主和管理层; 2、主要来自于北京和广东两个地区; 3、微博主要通过iPhone、三星Galaxy手机客户端和其他Android系统平台发布, 其中 包含少量小米手机, 但比重仅占到8%; 4、主要集中在35-45岁年龄段; 大多为男性。 |
| 宅男 | 465 | 1、主要集中在15-25岁和25-35岁两个年龄段; 2、微博主要通过个人电脑或者是类似塞班这样的老式智能手机系统发布。 |
| IT从业人员 | 916 | 1、主要是IT企业官方微博和IT从业人员; 2、主要来自于北京和广东两个地区; 3、微博主要通过三星Galaxy, 小米手机客户端和其他Android系统平台发布, 小米手机比重为33%; 4、主要集中在25-35岁和35-45岁两个年龄段。 |
| 群体关键字 | 用户数目 | 主要特征 |
| 时尚女性 | 640 | 1、时尚杂志官方微博, 企业白领和主要从事模特、设计师等工作的时尚潮流女士; 2、主要来自于北京、上海、香港和海外; 3、微博主要通过iPhone和三星Galaxy手机客户端发布; 4、主要集中在15-25岁和25-35岁两个年龄段。 |
| 大龄消费者 | 378 | 1、微博主要通过三星Galaxy、小米手机客户端、塞班和其他Android系统平台发布, 小米手机比重为0.02%; 2、年龄段主要集中在35-45岁以及45-55岁两个年龄段。 |
| 智能手机发烧友 | 552 | 1、主要是智能手机论坛官方微博以及智能手机分析师、发烧友; 2、主要来自于北京、上海和广东三个地区; 3、主要集中于25-35岁年龄段。 |
| 宅女 | 551 | 1、微博主要通过个人电脑或者是类似于塞班这样的老式智能手机系统发布; 2、主要集中在15-25岁和25-35岁两个年龄段。 |
| 青年学生 | 981 | 1、主要集中在15-25岁年龄段。 |
在对微博用户影响力进行分析时, 本文选取微博中较为常用的属性指标: 粉丝数、微博被评论数、微博被转发数。本文加入两个新的指标: “粉丝数/关注数”以及“粉丝数/原创微博数”。表5是根据K-means聚类算法聚类后的结果。
表5 各类别评价指标等级标准
| 等级 | 1级 | 2级 | 3级 |
|---|---|---|---|
| 粉丝数 | $\left[ 10000,+\infty \right)$ | $\left[ 1000,10000 \right)$ | $\left[ 0,1000 \right)$ |
| 评论数 | $\left[ 50,+\infty \right)$ | $\left[ 1,50 \right)$ | 0 |
| 转发数 | $\left[ 100,+\infty \right)$ | $\left[ 1,100 \right)$ | 0 |
| 粉丝数/关注数 | $\left[ 100,+\infty \right)$ | $\left[ 1,100 \right)$ | 0 |
| 粉丝数/微博数 | $\left[ 50,+\infty \right)$ | $\left[ 2,50 \right)$ | $\left[ 0,2 \right)$ |
根据确定好的用户影响力评价指标等级标准以及单指标未确知测度计算方法, 构造出关于评价对象的单指标的未确知测度函数。表6列举了6个用户的影响力识别过程。
表6 用户各指标数值
| 用户名 | 粉丝数(个) | 评论数(条) | 转发数(条) | 粉丝数/ 关注数 | 粉丝数/ 微博数 |
|---|---|---|---|---|---|
| A | 11 305 | 4 | 92 | 25.1222 | 25.3475 |
| B | 42 984 | 54 | 200 | 55.4632 | 7.4547 |
| C | 147 906 | 0 | 891 | 68.3897 | 7.5824 |
| D | 121 846 | 130 | 906 | 74.1607 | 14.0262 |
| E | 1 050 | 3 | 7 | 2.4083 | 0.2385 |
| F | 1 123 | 4 | 0 | 0.5831 | 2.0912 |
计算出这6个用户的单指标测度值, 用矩阵形式表示如下:
${{({{\lambda }_{1jk}})}_{5\times 3}}=\left( \begin{matrix} 1 & 0 & 0 \\ 0 & 0.0789 & 0.9211 \\ 0.8384 & 0.1616 & 0 \\ 0 & 0.3260 & 0.6740 \\ 0 & 0.9583 & 0.0417 \\\end{matrix} \right)$
${{({{\lambda }_{2jk}})}_{5\times 3}}=\left( \begin{matrix} 1 & 0 & 0 \\ 0 & 0.4082 & 0.5918 \\ 0 & 0.6054 & 0.3946 \\ 1 & 0 & 0 \\ 0.8309 & 0.1691 & 0 \\\end{matrix} \right)$
${{({{\lambda }_{3jk}})}_{5\times 3}}=\left( \begin{matrix} 1 & 0 & 0 \\ 0 & 0.2041 & 0.7959 \\ 0.2121 & 0.7879 & 0 \\ 0.2975 & 0.7025 & 0 \\ 0 & 0.2326 & 0.7674 \\\end{matrix} \right)$
${{({{\lambda }_{4jk}})}_{5\times 3}}=\left( \begin{matrix} 1 & 0 & 0 \\ 1 & 0 & 0 \\ 1 & 0 & 0 \\ 0.4258 & 0.5742 & 0 \\ 0 & 0.5011 & 0.4989 \\\end{matrix} \right)$
${{({{\lambda }_{5jk}})}_{5\times 3}}=\left( \begin{matrix} 0 & 0.0111 & 0.9889 \\ 0 & 0.0816 & 0.9184 \\ 0 & 0.1212 & 0.8788 \\ 0 & 0 & 1 \\ 0 & 0 & 1 \\\end{matrix} \right)$
${{({{\lambda }_{6jk}})}_{5\times 3}}=\left( \begin{matrix} 0 & 0.0273 & 0.9727 \\ 0 & 0.1224 & 0.8776 \\ 0 & 0 & 1 \\ 0 & 0 & 1 \\ 0 & 0.0038 & 0.9962 \\\end{matrix} \right)$
由公式(5)-公式(7)测算得出以上6个用户各个单指标测度评价方案的多指标的综合测度评价矩阵为:
$A=W\cdot \left( {{\lambda }_{3\times 6}} \right)=\left( \begin{matrix} 0.4190 & 0.3237 & 0.1990 \\ 0.6091 & 0.1665 & 0.1544 \\ 0.3642 & 0.3469 & 0.2890 \\ 0.7829 & 0.1309 & 0.0685 \\ 0 & 0.0376 & 0.9624 \\ 0 & 0.1166 & 0.9737 \\\end{matrix} \right)$
根据综合测度矩阵A, 分别对6个用户的影响力进行识别并排序, 取$\lambda =0.6$。在此基础下, 最终得到6个用户的影响力如下:
$\begin{align} & {{p}_{1}}=2.1781,\ \ {{p}_{2}}=2.600,\ \ {{p}_{3}}=2.0809, \\ & {{p}_{4}}=2.7880,\ \ {{p}_{5}}=1.0376,\ \ {{p}_{6}}=1.0115 \\ \end{align}$
影响力值排序为${{p}_{4}}>{{p}_{2}}>{{p}_{1}}>{{p}_{3}}>{{p}_{5}}>{{p}_{6}}$。
在最终结果中, 用户C虽然为6个用户里面粉丝数最高的, 但是影响力值并不高, 可以看出, 运用这种综合的未确知测度算法测算出的用户影响力, 能有效排除微博中的僵尸粉、网络水军等的影响, 相较于传统方法判定用户的影响力, 最终结果更客观。
最终, 通过未确知测度模型测算出属于第一影响力等级的微博用户为47名, 第二影响力等级的微博发表者为265名, 第三等级的微博发表者为4 688名。
通过前面的实验数据计算求得最终的基于微博用户群体的价值矩阵, 如图1所示。
从图1可以看出, 群体2(IT业精英)和群体5(时尚女性)为“明星用户”这表明, 在A手机的所有消费者群体中, 喜欢追赶时髦的女性群体、在IT行业从业人员、公司中高层管理者不仅更青睐这项产品, 而且这两个类型的消费者的影响力也较大, 一定程度上能引导其他消费者群体购买A手机。因此, 企业在制定营销策略时, 如何为这两类消费者群体提供更优质的产品和服务, 以及如何利用这两类消费者群体创造更高的价值将是关键点。群体6(大龄消费者)和群体3(宅男)为“瘦狗”用户。这表明这两类消费者群体对A手机不感兴趣或者持负面态度, 在今后的生活中也不大可能购买使用A手机。企业在做产品营销时, 对这类用户不应投入过高期望和过多的营销成本和精力。
本文以目前比较流行的智能手机A为研究对象, 以新浪微博中收集到的数据为研究样本, 基于微博用户情感分析技术, 用户影响力识别技术以及用户群体特征分析技术进行关于消费者群体特征分析的研究。从实验结果可以看出, A手机更受喜欢追赶时髦的女性群体以及在IT行业从业人员的追捧, 这两个群体能更有效地影响消费者购买该手机, 而大龄消费者和宅男能对A手机持否定态度。但文章仍存在一些不足: 在进行文本情感分析时, 新方法效果虽然有进步, 但是并没有考虑网络流行语言以及一些其他因素的影响, 使得有些文本仍然不能被准确识别, 对实验结果造成一定误差。另外在进行用户群体特征分析时, 对于4个用户群体象限的划分, 仅仅是根据用户群体平均影响力值及用户群体总体情感值进行测算, 结果并不十分严谨。在今后的研究中, 应结合更多影响因子采用更科学的算法进行用户群体象限的划分。
何跃: 提出研究方法, 修订论文;
尹小佳: 提出研究思路, 设计研究方案, 撰写论文;
朱超: 论文最终版本修订。
所有作者声明不存在利益冲突关系。
支撑数据由作者自存储, E-mail: yinxiaojia.xx@foxmail.com。
[1] 尹小佳. 最终数据一览表1. data.zip. 特征识别表.
[2] 尹小佳. 最终数据一览表2. data.zip. 微博数据表.
[3] 尹小佳. 最终数据一览表3. data.zip. 用户信息表.
| [1] |
第39次中国互联网络发展状况统计报告 [R/OL]. [The 33rd Statistical Report on Internet Development in China [R/OL]. [ |
| [2] |
Characteristics and Social Impact of the Use of Social Media by Chinese Dama [J].https://doi.org/10.1016/j.tele.2016.05.020 URL [本文引用: 1] 摘要
Against the backdrop of broader social changes, social media has developed rapidly in China, which has pushed the transition of the media environment from a traditional authority-dominated one to a modern media society. In particular, the use of social media by Chinese Dama can be perceived as an exemplar of media-driven social change. ‘Chinese Dama’ is a buzzword coined in tandem with the development of social media since 2013. This term represents a particular group of middle-aged Chinese women who reflect a distinctive social phenomenon in China. It is noteworthy that a growing number of Chinese Dama are learning to use social media and have established thousands of social media communities, exerting significant influence on the wider media and social environment. This study focuses on the major changes undergone by Dama, transitioning from being passively covered by media to becoming active users of social media, and this research analyzes the motivations and hallmarks of their social media activity. Although the use of social media by Chinese Dama, the traditional nucleus of Chinese society, has contributed to narrowing the digital divide and resulted in the Dama’s gaining more discourse power and ushered in new diverse lifestyles, we argue that the Dama also exert a far-reaching positive and negative influence on society, pushing for the modernization transformation of the Chinese society.
|
| [3] |
Characterizing Awareness of Schizophrenia Among Facebook Users by Leveraging Facebook Advertisement Estimates [J].URL PMID: 28483739 [本文引用: 1] 摘要
Schizophrenia is a rare but devastating condition, affecting about 1% of the world’s population and resulting in about 2% of the US health care expenditure. Major impediments to appropriate and timely care include misconceptions, high levels of stigma, and lack of public awareness. Facebook offers novel opportunities to understand public awareness and information access related to schizophrenia, and thus can complement survey-based approaches to assessing awareness that are limited in scale, robustness, and temporal and demographic granularity. The aims of this study were to (1) construct an index that measured the awareness of different demographic groups around schizophrenia-related information on Facebook; (2) study how this index differed across demographic groups and how it correlated with complementary Web-based (Google Trends) and non–Web-based variables about population well-being (mental health indicators and infrastructure), and (3) examine the relationship of Facebook derived schizophrenia index with other types of online activity as well as offline health and mental health outcomes and indicators. Data from Facebook’s advertising platform was programmatically collected to compute the proportion of users in a target demographic group with an interest related to schizophrenia. On consultation with a clinical expert, several topics were combined to obtain a single index measuring schizophrenia awareness. This index was then analyzed for differences across US states, gender, age, ethnic affinity, and education level. A statistical approach was developed to model a group’s awareness index based on the group’s characteristics. Overall, 1.03% of Facebook users in the United States have a schizophrenia-related interest. The schizophrenia awareness index (SAI) is higher for females than for males (1.06 vs 0.97,P<.001), and it is highest for the people who are aged 25-44 years (1.35 vs 1.03 for all ages,P<.001). The awareness index drops for higher education levels (0.68 for MA or PhD vs 1.92 for no high school degree,P<.001), and Hispanics have the highest level of interest (1.57 vs 1.03 for all ethnic affinities,P<.001). A regression model fit to predict a group’s interest level achieves an adjustedR2=0.55. We also observe a positive association between our SAI and mental health services (or institutions) per 100,000 residents in a US state (Pearsonr=.238,P<.001), but a negative association with the state-level human development index (HDI) in United States (Pearsonr=61.145,P<.001) and state-level volume of mental health issues in United States (Pearsonr=61.145,P<.001). Facebook’s advertising platform can be used to construct a plausible index of population-scale schizophrenia awareness. However, only estimates of awareness can be obtained, and the index provides no information on the quality of the information users receive online.
|
| [4] |
ACO-based Clustering for Ego Network Analysis [J].https://doi.org/10.1016/j.future.2016.06.033 URL [本文引用: 1] 摘要
The unstoppable growth of Social Networks (SNs), and the huge number of connected users, have become these networks as one of the most popular and successful domains for a large number of research areas. The different possibilities, volume and variety that these SNs offer, has become them an essential tool for every-day working and social relationships. One of the basic features that any SN provides is to allow users to group, organize and classify their connections into different groups, or “circles”. These circles can be defined using different characteristics as roommates, workmates, hobbies, professional skills, etc. The problem of finding these circles taking into account the variety, volume and dynamics of these SNs has become an important challenge for a wide number of Computer Science areas, as Big Data, Data Mining or Machine Learning among others. Problems related to pre-processing, fusion and knowledge discovering of information from these sources are still an open question. This paper presents a new Bio-inspired method, based on Ant Colony Optimization (ACO) algorithms, that has been designed to find and analyze these circles. Given any user in a network, the new method is able to automatically determine the different users that compose his/her groups or circles of interest, so the network will be clustered into different components based on the users profiles and their dynamics. This algorithm has been applied to Ego Networks where the node centering the network (called “Ego”) represents the user being studied. In this work two different ACO algorithms, that differ in the source of information used to perform the community finding tasks, have been designed. The first ACO algorithm uses the information extracted from the topology of the network, whereas the second one uses the profile information provided by users. The proposed algorithms are able to detect the different circles in three popular Social Networks: Facebook, Twitter and Google+. Finally, and using several databases from previous SNs, an experimental evaluation of our methods has been carried out to show how the algorithms are currently working.
|
| [5] |
Influence Model of User Behavior Characteristics on Information Dissemination [J].https://doi.org/10.15837/ijccc.2016.2.2441 URL [本文引用: 1] 摘要
ABSTRACT Quantitative analysis on human behavior, especially mining and modeling temporal and spatial regularities, is a common focus of statistical physics and complexity sciences. The in-depth understanding of human behavior helps in explaining many complex socioeconomic phenomena, and in finding applications in public opinion monitoring, disease control, transportation system design, calling center services, information recommendation. In this paper,we study the impact of human activity patterns on information diffusion. Using SIR propagation model and empirical data, conduct quantitative research on the impact of user behavior on information dissemination. It is found that when the exponent is small, user behavioral characteristics have features of many new dissemination nodes, fast information dissemination, but information continued propagation time is short, with limited influence; when the exponent is big, there are fewer new dissemination nodes, but will expand the scope of information dissemination and extend information dissemination duration; it is also found that for group behaviors, the power-law characteristic a greater impact on the speed of information dissemination than individual behaviors. This study provides a reference to better understand influence of social networking user behavior characteristics on information dissemination and kinetic effect.
|
| [6] |
User and Content Characteristics of Public Tweets Referencing Little Cigars [J].https://doi.org/10.5993/AJHB.40.1.5 URL PMID: 26685812 [本文引用: 1] 摘要
The article discusses a mixed-methods study that assesses the content of public tweets and profile photographs sampled from a search of 2 little cigars and cigarillos brands Black & Mild and Swisher Sweets. Study highlights include thematic analysis of the tweets via an iterative immersion and crystallization method, ways in which coding categories were developed, and a table that outlines Twitter user characteristics as observed in profile pictures.
|
| [7] |
基于微博的大数据用户画像与精准营销 [J].Based on Microblogging Large Data User Portrait and Precise Marketing [J]. |
| [8] |
微博客用户特征分析及分类研究——以“新浪微博”为例 [J].
以新浪微博为例,通过网络爬虫软件抓取新浪用户的相关信息。使用计量学方法,对用户特征进行统计分析,并利用决策树分析、相关性分析和关联挖掘用户特征。结果表明:新浪微博的认证用户和非认证用户之间存在明显差异;微博客用户的特性、发布微文时间段、微文长度、关注者、粉丝量和微文数等具有统计特性,地域差异明显;微博客用户选择是否公布城市,是否允许所有人私信、评论等之间存在一定关联关系;另外,通过对用户的分类发现,其中三种类型的用户群体之和占用户总体的85%以上,具有显著特性,为微博客用户特性的深入研究提供参考依据。
Research on Behavior Characteristics and Classification of Micro-blog Users— Taking “Sina Micro-blog”as an Example [J].
以新浪微博为例,通过网络爬虫软件抓取新浪用户的相关信息。使用计量学方法,对用户特征进行统计分析,并利用决策树分析、相关性分析和关联挖掘用户特征。结果表明:新浪微博的认证用户和非认证用户之间存在明显差异;微博客用户的特性、发布微文时间段、微文长度、关注者、粉丝量和微文数等具有统计特性,地域差异明显;微博客用户选择是否公布城市,是否允许所有人私信、评论等之间存在一定关联关系;另外,通过对用户的分类发现,其中三种类型的用户群体之和占用户总体的85%以上,具有显著特性,为微博客用户特性的深入研究提供参考依据。
|
| [9] |
中国网络消费者行为特征 [J].Behavior Analysis of Chinese Internet Consumer [J]. |
| [10] |
“海淘族”的发展与群体特征 [J].The Development and Group Characteristics of International Shoppers in China [J]. |
| [11] |
移动社交网络环境下基于情景化偏好的用户行为感知研究 [J].Study on User Behavior Perception Based on Situational Preference in Mobile Social Network Environment [J]. |
| [12] |
Sentiment Analysis Leveraging Emotions and Word Embeddings [J].https://doi.org/10.1016/j.eswa.2016.10.043 URL [本文引用: 1] 摘要
Sentiment analysis and opinion mining are valuable for extraction of useful subjective information out of text documents. These tasks have become of great importance, especially for business and marketing professionals, since online posted products and services reviews impact markets and consumers shifts. This work is motivated by the fact that automating retrieval and detection of sentiments expressed for certain products and services embeds complex processes and pose research challenges, due to the textual phenomena and the language specific expression variations. This paper proposes a fast, flexible, generic methodology for sentiment detection out of textual snippets which express people opinions in different languages. The proposed methodology adopts a machine learning approach with which textual documents are represented by vectors and are used for training a polarity classification model. Several documents vector representation approaches have been studied, including lexicon-based, word embedding-based and hybrid vectorizations. The competence of these feature representations for the sentiment classification task is assessed through experiments on four datasets containing online user reviews in both Greek and English languages, in order to represent high and weak inflection language groups. The proposed methodology requires minimal computational resources, thus, it might have impact in real world scenarios where limited resources is the case.
|
| [13] |
An Unsupervised Fuzzy Clustering Method for Twitter Sentiment Analysis [C]// |
| [14] |
Two Evidential Data Based Models for Influence Maximization in Twitter [J].https://doi.org/10.1016/j.knosys.2017.01.014 URL [本文引用: 1] 摘要
Influence maximization is the problem of selecting a set of influential users in the social network. Those users could adopt the product and trigger a large cascade of adoptions through the “word of mouth” effect. In this paper, we propose two evidential influence maximization models for Twitter social network. The proposed approach uses the theory of belief functions to estimate users influence. Furthermore, the proposed influence estimation measure fuses many influence aspects in Twitter, like the importance of the user in the network structure and the popularity of user’s tweets (messages). In our experiments, we compare the proposed solutions to existing ones and we show the performance of our models.
|
| [15] |
Influence-based Twitter Browsing with NavigTweet [J].https://doi.org/10.1016/j.is.2016.07.012 URL [本文引用: 1] 摘要
Directed links in social media determine the flow of information and, hence, indicate a user's influence. This paper proposes a novel visual framework to explore Twitter's ‘ Who Follows Who ’ relationships, by browsing the friends’ network to identify key influencers based on the actual influence of the content they share. We have developed NavigTweet, a visualization tool for the influence-based exploration of Twitter network. NavigTweet embeds a force-directed algorithm to display the graph in a multi-clustered way. To assess the user experience with NavigTweet, we have conducted a pre-release qualitative pilot study. We also report on the study and results of post-release user feedback survey.
|
| [16] |
Looking for the Perfect Tweet. The Use of Data Mining Techniques to Find Influencers on Twitter [J].https://doi.org/10.1016/j.chb.2016.07.035 URL [本文引用: 1] 摘要
The purpose of this study is to investigate influencers on Twitter to discover the characteristics of their tweets through PIAR, a unique data mining research tool developed by the University of Salamanca that combines graph theory and social influence theory. An analysis of 3853 users posting about two automotive Japanese car firms, Toyota and Nissan, reveals the characteristics influencers have on this social network. The findings suggest that influencers use more hashtags and mentions on average when they tweet, and their word count is fewer than those with less power on this virtual community. Surprisingly, they tend to include less embedded links on their posts. Additionally, influencers have on average a large number of people they follow and they clearly express their opinions and feelings (either positive or negative) when tweeting. The results broaden the understanding of how influencers write and behave on social networks when they communicate with their users' community. Further, it provides insights for practitioners and marketers on how to discover influencers talking about their brands by observing tweets' content.
|
| [17] |
面向微博短文本的细粒度情感特征抽取方法 [J].
A Microblog Short Text Oriented Multi-class Feature Extraction Method of Fine-Grained Sentiment Analysis [J].
|
| [18] |
汉语转折关联词语语义背景探析及教学应用 [D].The Semantic Backgrounds Study of Adversative Words and Expressions and Application in Chinese Teaching [D]. |
| [19] |
Content Analysis in Library and Information Science Research [J].https://doi.org/10.1002/(SICI)1097-4571(199007)41:5<390::AID-ASI12>3.0.CO;2-G URL [本文引用: 1] 摘要
ABSTRACT Content analysis is used to identify and record the meaning of documents and other forms of communication in a systematic and quantitative way. This article surveys how content analysis is being used in library and information science research. Key methodological concerns are also addressed. Care is required in selecting samples of materials to be analyzed, in selecting categories for analysis, and in eliminating any researcher bias from the analysis. If employed in a rigorous manner, content analysis can be used fruitfully to address many questions in library and information science research.
|
| [20] |
基于领域的微博用户影响力计算方法 [J].
为了充分考虑微博的跨领域与领域交叉性特点,提出了基于领域的微博用户影响力的计算方法.该方法依据用户的微博内容与ODP领域本体的相似度,通过KNN领域分类算法判别微博所属的领域;并根据用户的粉丝数、被提及数、被评论数、在线时间与注册时间、微博的转发数等参数运用影响力计算公式分别计算用户在各领域的影响力,从而确定微博用户在各领域的影响力大小.实验表明,本文的计算方法充分考虑了微博的跨领域性与领域交叉性特点,并能更好地计算用户在各领域的影响力大小.
Calculation Method of User Influence Based on Domain [J].
为了充分考虑微博的跨领域与领域交叉性特点,提出了基于领域的微博用户影响力的计算方法.该方法依据用户的微博内容与ODP领域本体的相似度,通过KNN领域分类算法判别微博所属的领域;并根据用户的粉丝数、被提及数、被评论数、在线时间与注册时间、微博的转发数等参数运用影响力计算公式分别计算用户在各领域的影响力,从而确定微博用户在各领域的影响力大小.实验表明,本文的计算方法充分考虑了微博的跨领域性与领域交叉性特点,并能更好地计算用户在各领域的影响力大小.
|
| [21] |
微博用户的影响力指数模型 [J].
以新浪微博为研究对象,提出微博用户的用户影响力指数模型。首先将得到的用户被关注度取代当前存在虚假的用户粉丝数,通过较为合理的用户被关注度计算得到微博用户的用户活跃度与微博影响力,最后将用户活跃度与微博影响力作为用户影响力的影响因子合成微博用户的用户影响力。模型考察用户与用户微博两个角度的多个活动因子。实验结果表明,用户影响力指数模型在降低微博僵尸粉影响的同时,能够较合理地体现微博用户的实际影响力。
Influence Index Model of Micro-blog User [J].
以新浪微博为研究对象,提出微博用户的用户影响力指数模型。首先将得到的用户被关注度取代当前存在虚假的用户粉丝数,通过较为合理的用户被关注度计算得到微博用户的用户活跃度与微博影响力,最后将用户活跃度与微博影响力作为用户影响力的影响因子合成微博用户的用户影响力。模型考察用户与用户微博两个角度的多个活动因子。实验结果表明,用户影响力指数模型在降低微博僵尸粉影响的同时,能够较合理地体现微博用户的实际影响力。
|
| [22] |
K-means算法初始聚类中心选择的优化 [J].https://doi.org/10.3778/j.issn.1002-8331.1111-0289 URL Magsci [本文引用: 1] 摘要
针对传统K-means算法对初始聚类中心敏感的问题,提出了基于数据样本分布情况的动态选取初始聚类中心的改进K-means算法。该算法根据数据点的距离构造最小生成树,并对最小生成树进行剪枝得到K个初始数据集合,得到初始的聚类中心。由此得到的初始聚类中心非常地接近迭代聚类算法收敛的聚类中心。理论分析与实验表明,改进的K-means算法能改善算法的聚类性能,减少聚类的迭代次数,提高效率,并能得到稳定的聚类结果,取得较高的分类准确率。
Optimization to K-means Initial Cluster Centers [J].https://doi.org/10.3778/j.issn.1002-8331.1111-0289 URL Magsci [本文引用: 1] 摘要
针对传统K-means算法对初始聚类中心敏感的问题,提出了基于数据样本分布情况的动态选取初始聚类中心的改进K-means算法。该算法根据数据点的距离构造最小生成树,并对最小生成树进行剪枝得到K个初始数据集合,得到初始的聚类中心。由此得到的初始聚类中心非常地接近迭代聚类算法收敛的聚类中心。理论分析与实验表明,改进的K-means算法能改善算法的聚类性能,减少聚类的迭代次数,提高效率,并能得到稳定的聚类结果,取得较高的分类准确率。
|
| [23] |
基于未确知测度模型的高新区技术创新能力评价研究 [J].https://doi.org/10.3969/j.issn.1000-7695.2008.05.044 URL [本文引用: 1] 摘要
经济全球化导致人们寻求利用本地天然优势或获得性优势形成具有专业特色的区域,以培育本地在全球经济中的竞争力。在需要不断创造新知识的全球化经济体系中,高新区的作用日趋重要,正在成为地方经济变迁和重塑或提升竞争力的核心动力。而高新区的技术创新能力又是影响高新区发展的决定性因素,是区别于一般工业园区和其它区域的本质特征。文章在综合国内外学者相关文献的基础上构建了高新区技术创新能力评价指标体系,应用未确知测度模型对其进行综合评价,并结合具体实例判别其技术创新能力的整体水平。
Evaluation of Technological Innovation Capability of High-tech Zones Based on Unascertained Measurement Model [J].https://doi.org/10.3969/j.issn.1000-7695.2008.05.044 URL [本文引用: 1] 摘要
经济全球化导致人们寻求利用本地天然优势或获得性优势形成具有专业特色的区域,以培育本地在全球经济中的竞争力。在需要不断创造新知识的全球化经济体系中,高新区的作用日趋重要,正在成为地方经济变迁和重塑或提升竞争力的核心动力。而高新区的技术创新能力又是影响高新区发展的决定性因素,是区别于一般工业园区和其它区域的本质特征。文章在综合国内外学者相关文献的基础上构建了高新区技术创新能力评价指标体系,应用未确知测度模型对其进行综合评价,并结合具体实例判别其技术创新能力的整体水平。
|
| [24] |
基于BSC和未确知测度理论的C2C网商绩效评价模型研究——以淘宝网店铺数据为例 [J].Study on Performance Evaluation Model of C2C Network Business Based on BSC and Unascertained Measure Theory - Taking Taobao Store Data as an Example [J]. |
| [25] |
基于信息熵和未确知测度理论的供应链风险系数定量测度模型研究 [J].Study on Quantitative Model of Supply Chain Risk Coefficient Based on Information Entropy and Unascertained Measure Theory [J]. |
| [26] |
The Mathematical Theory of Communication [M]. |
| [27] |
基于离差最大化和Ward系统聚类的医疗服务水平研究 [J].
为了促进江苏省各地区医疗服务 水平协调发展,文章对2010年江苏省各地区医疗服务水平进行了综合分析。通过离差最大化方法求出江苏省各地区医疗服务水平的综合评价值和排名;采用 Ward系统聚类的方法对各地区服务水平进行归类,并从服务条件与服务效果两个方面分析各地区的优势和不足,从而为江苏省医疗事业发展与改革提供依据。
Research on Medical Service Level Based on Maximizing Deviations and Clustering Ward Systems [J].
为了促进江苏省各地区医疗服务 水平协调发展,文章对2010年江苏省各地区医疗服务水平进行了综合分析。通过离差最大化方法求出江苏省各地区医疗服务水平的综合评价值和排名;采用 Ward系统聚类的方法对各地区服务水平进行归类,并从服务条件与服务效果两个方面分析各地区的优势和不足,从而为江苏省医疗事业发展与改革提供依据。
|

/
| 〈 |
|
〉 |

